What can the Spreadsheet Generator do for you?
- Details
- Created: Thursday, 28 February 2019 14:41
With every Comet Assay IV purchase, you receive the Spreadsheet Generator absolutely free.
What can the Spreadsheet Generator do for you?
Easily graph and report your data
Comet Assay IV combines accurate, repeatable results with powerful data processing and comprehensive presentation. Once you have obtained your results, you can easily process them using the Spreadsheet Generator, which is included free with every Comet Assay IV system.
The Spreadsheet Generator is an application built in Excel for drawing graphs, tabulating data and calculating statistics from your Comet Assay IV results. Because it is built in Excel, it can easily be customised using any of Excel’s standard functions and features.
Includes all major measurement parameters
Comet Assay IV incorporates all major measurement parameters, including Olive tail moment and tail % DNA – widely regarded as the most informative measures of DNA damage in the comet assay.
With Comet Assay IV you can report the following:
•Olive tail moment
•Head % DNA
•Tail % DNA
•Head length
•Tail length
•Tail migration
•Mean grey level
•Total area
•Total intensity
•Width

The Spreadsheet Generator: Powerful data processing
All the comet assay results files produced by the Comet Assay IV system can be used with the Excel-based Spreadsheet Generator, which is supplied free with every Comet Assay IV system.
The Spreadsheet Generator is provided to help generate graphs and tables in Excel from the raw data produced by the Comet Assay IV program. The Spreadsheet Generator will extract data from any number of source files you specify, create tables and draw charts.
Full customization of the Spreadsheet Generator is possible, therefore the program can be used in compliance with the reporting system in your laboratory.
Spreadsheet Generator features:
- Create tables to compare data sets
- Draw charts bespoke to your project’s needs
- Amalgamate data from different experiments, studies or days, should you wish
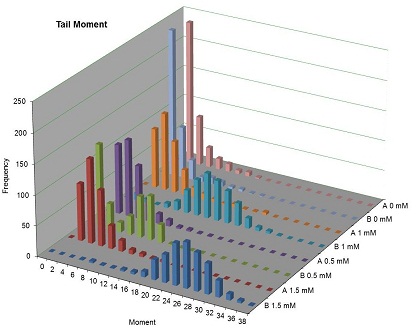
- Produce graphs including log transforms and frequency distribution graphs
- Generate summary statistics over any set of result files you choose
- Merge files for example, where there are several slides of the same dose and treatment
- Compare data across dose ranges
- Choose from a selection of BoxPlot and Histogram options
- Flexibility to adjust chart layouts and use them in other applications (e.g. copy and paste into reports, or automatically integrate using OLE)
- Customise your Spreadsheet Generator to include additional calculations and Excel charts (e.g. line and bar charts)
View some example plots on our website – http://www.scorecomets.com/comet-scoring/comet-assay-iv/results